Survey Plots
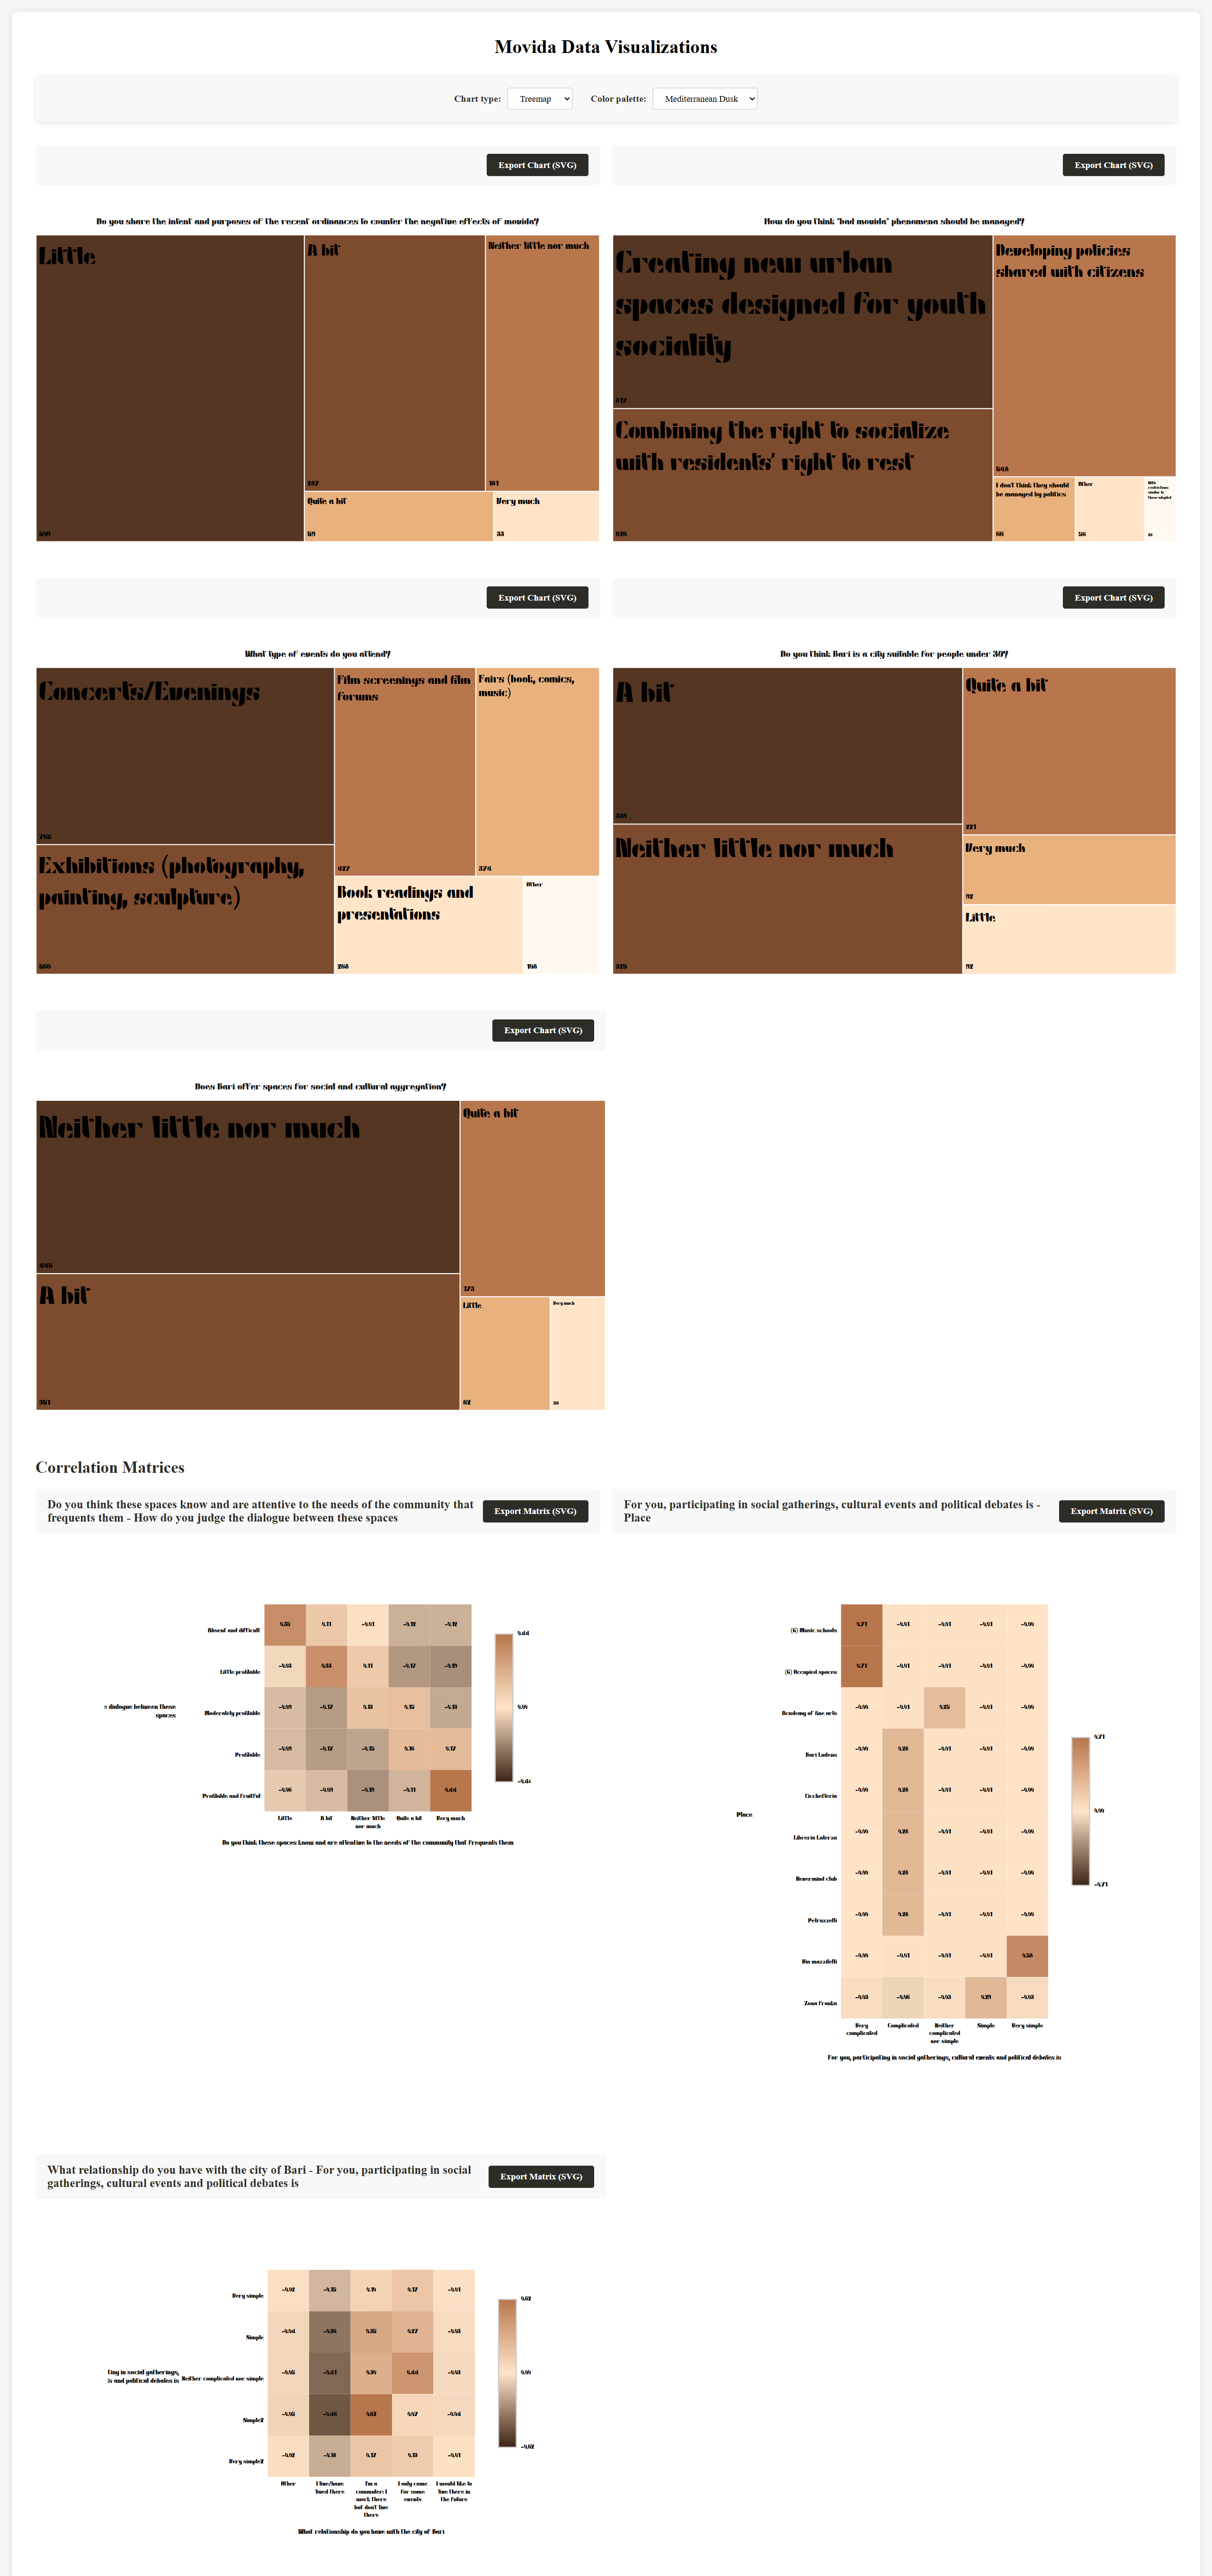
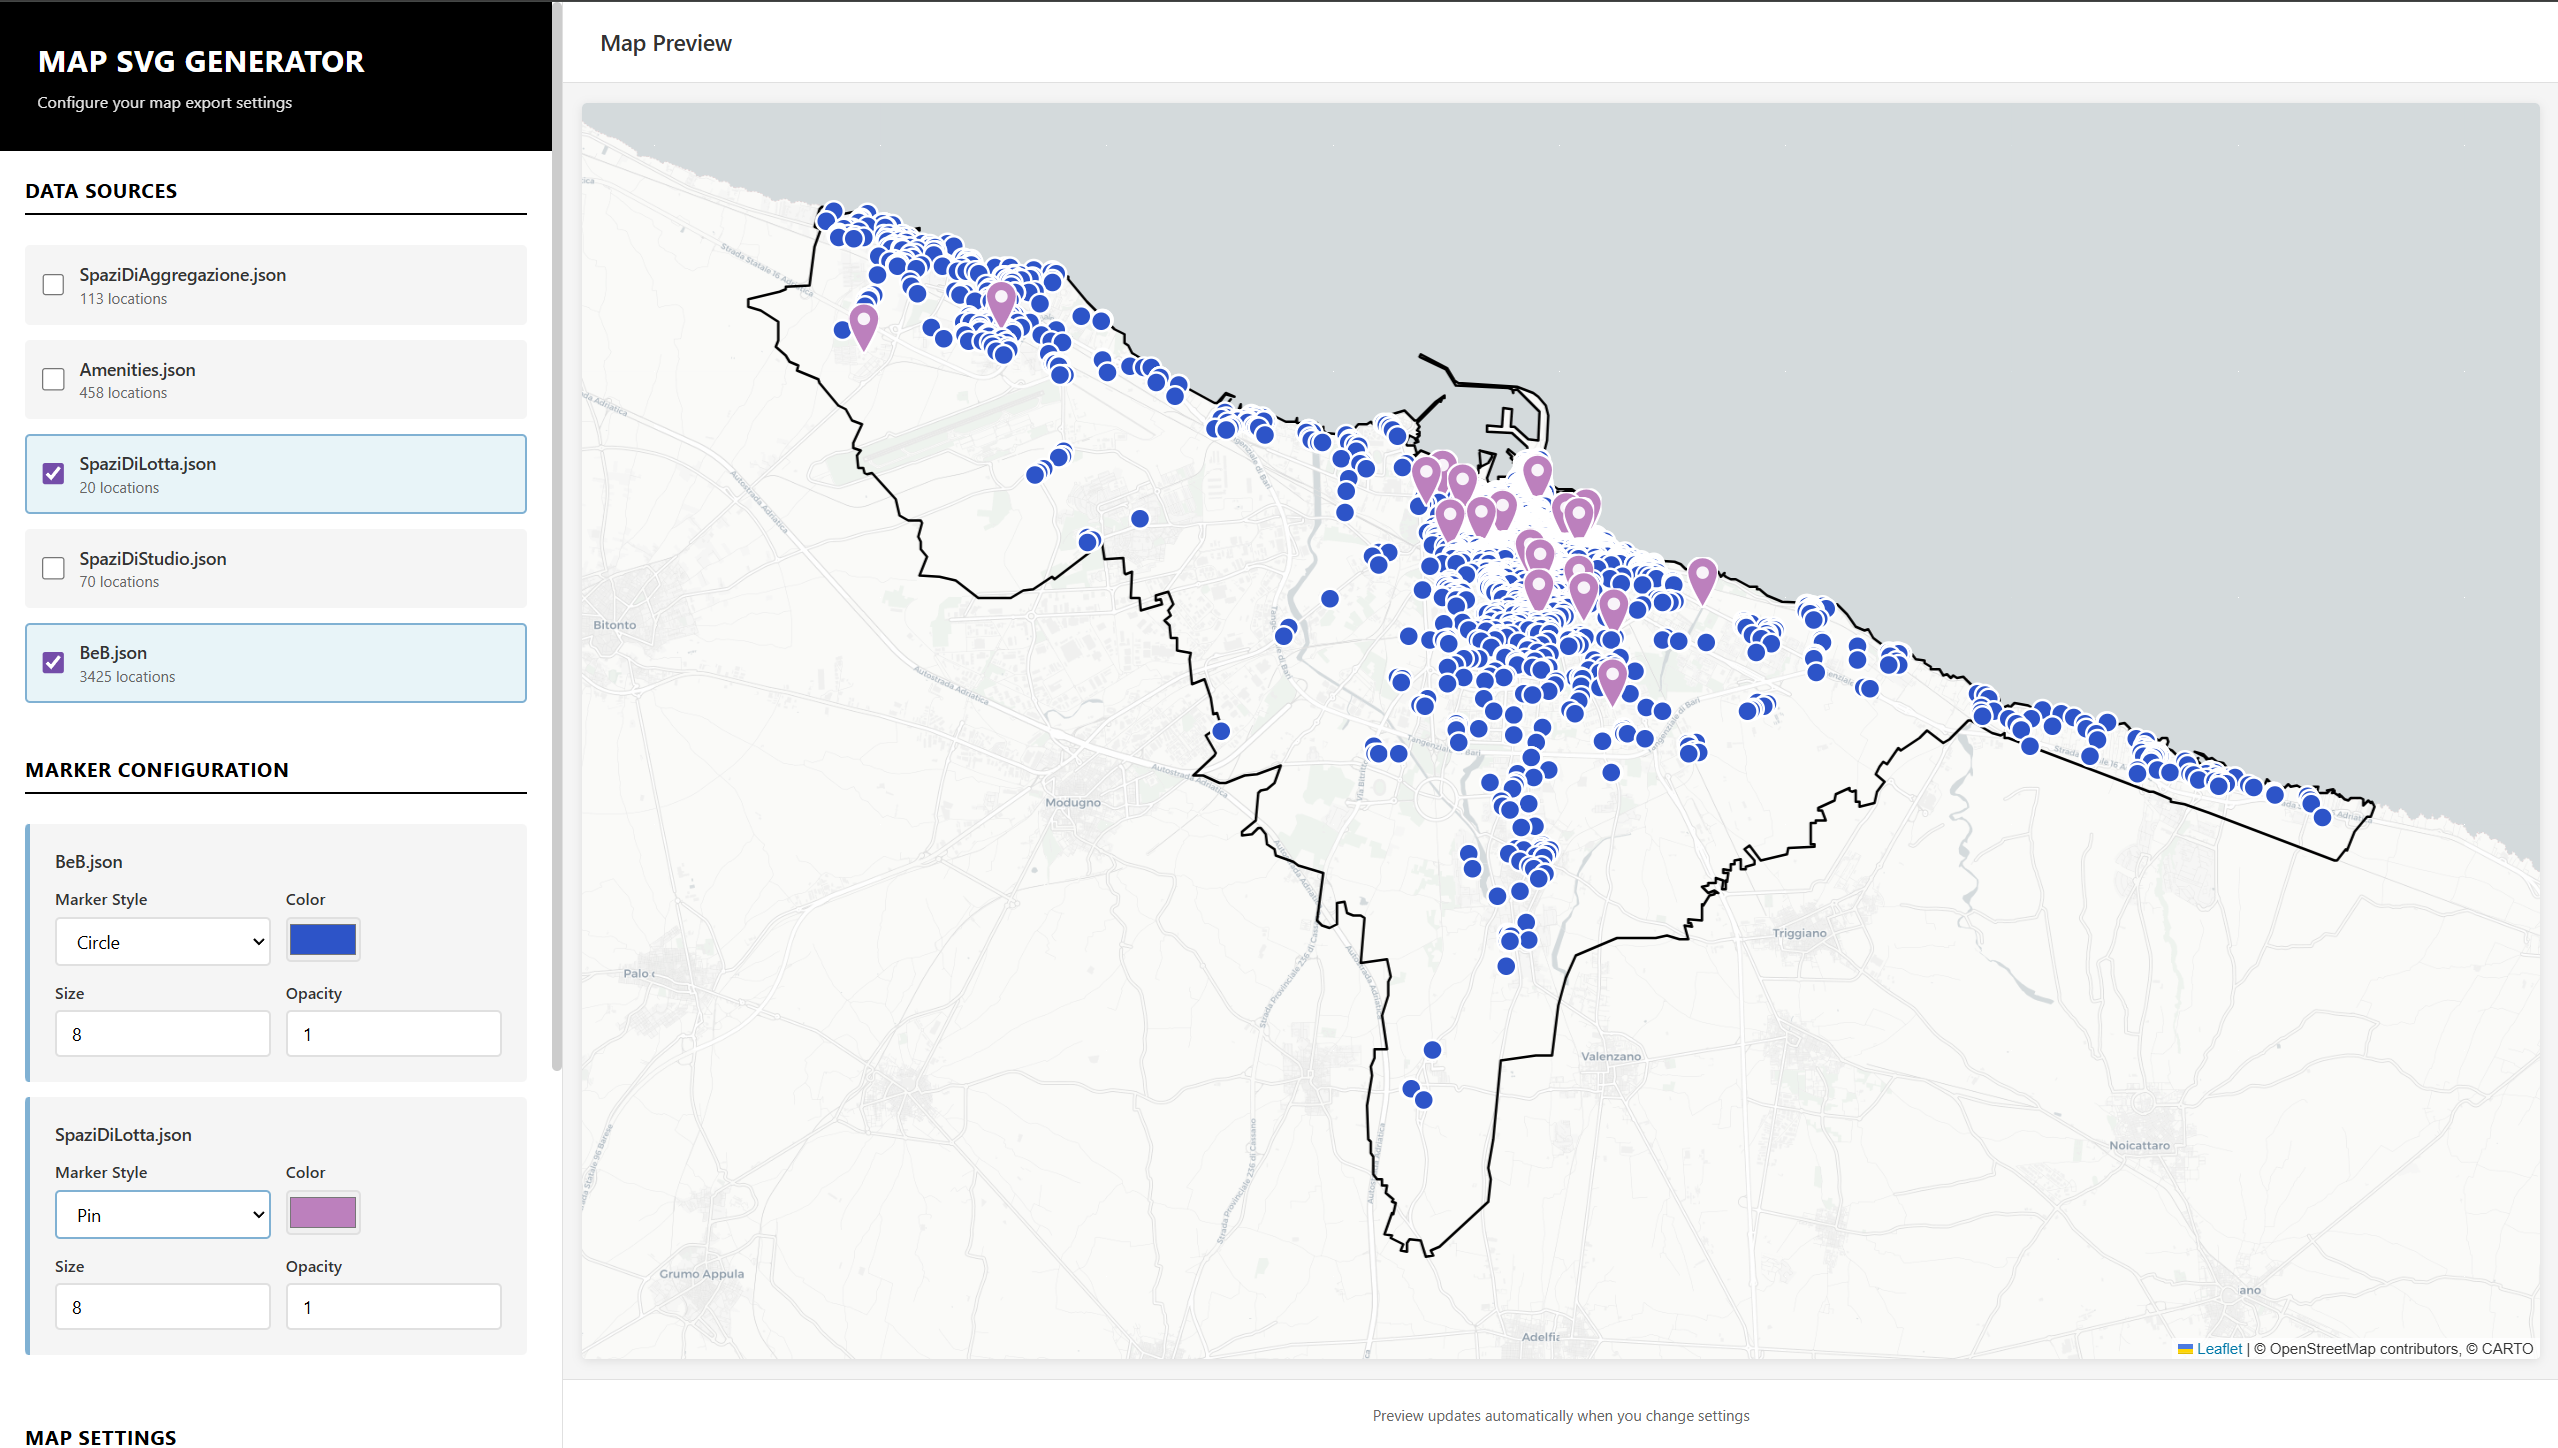
Interactive survey visualization dashboard with dynamic interchangable chart types and color palettes. Built with D3.js to transform structured survey data from Bari residents into publication-ready visualizations. Features three distinct chart modes (bar charts, pie charts, treemap hierarchies), ten curated color palettes optimized for print and accessibility, correlation heatmap matrices with diverging color scales, intelligent text wrapping and responsive layouts, SVG export with embedded custom fonts for design software integration. Includes sophisticated data processing: automatic sorting, value normalization, label collision detection and resolution. The modular architecture separates data loading, chart rendering, and export functionality, making it easily adaptable for different survey datasets while maintaining consistent visual quality across all output formats.